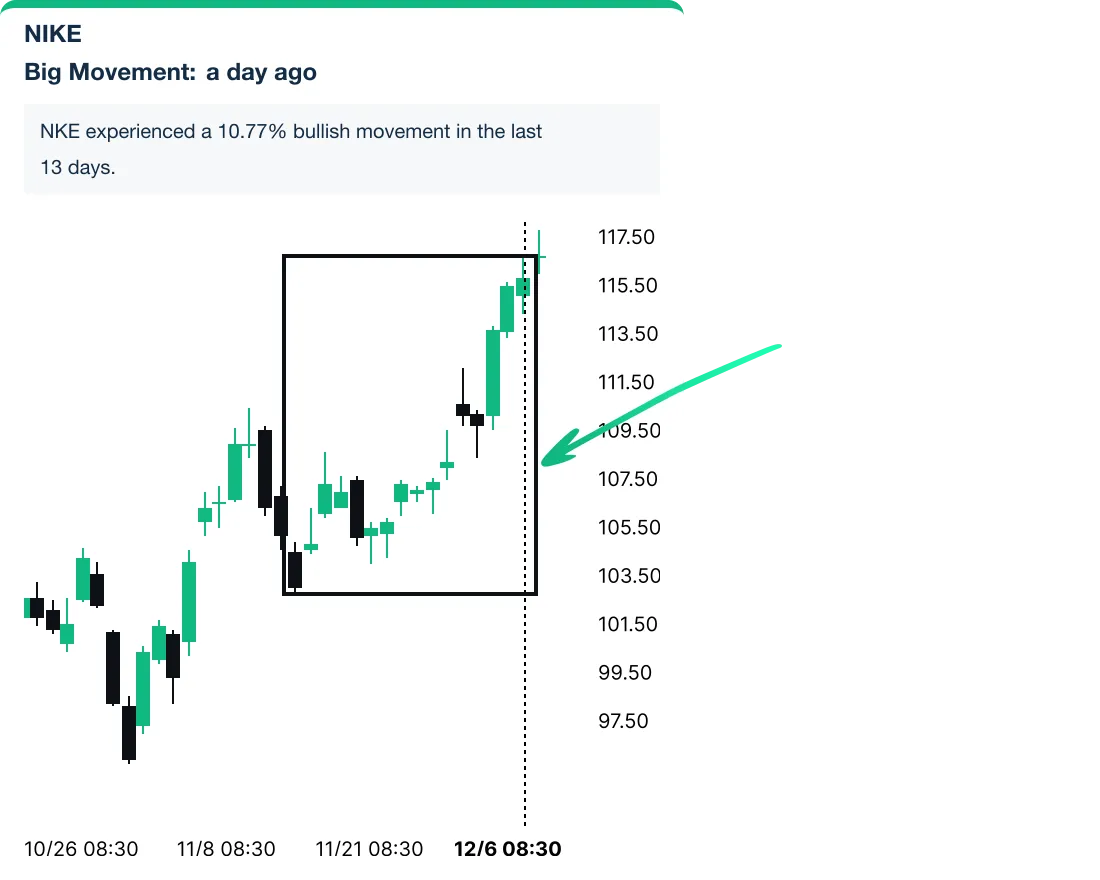
Statistical Analysis
Statistical analysis in trading involves collecting and interpreting quantitative data to uncover patterns and make informed forecasts about market behaviour. Autochartist applies statistical analysis of stocks and markets to model the probability of specific events, such as significant price moves, providing valuable insights into stock market dynamics.
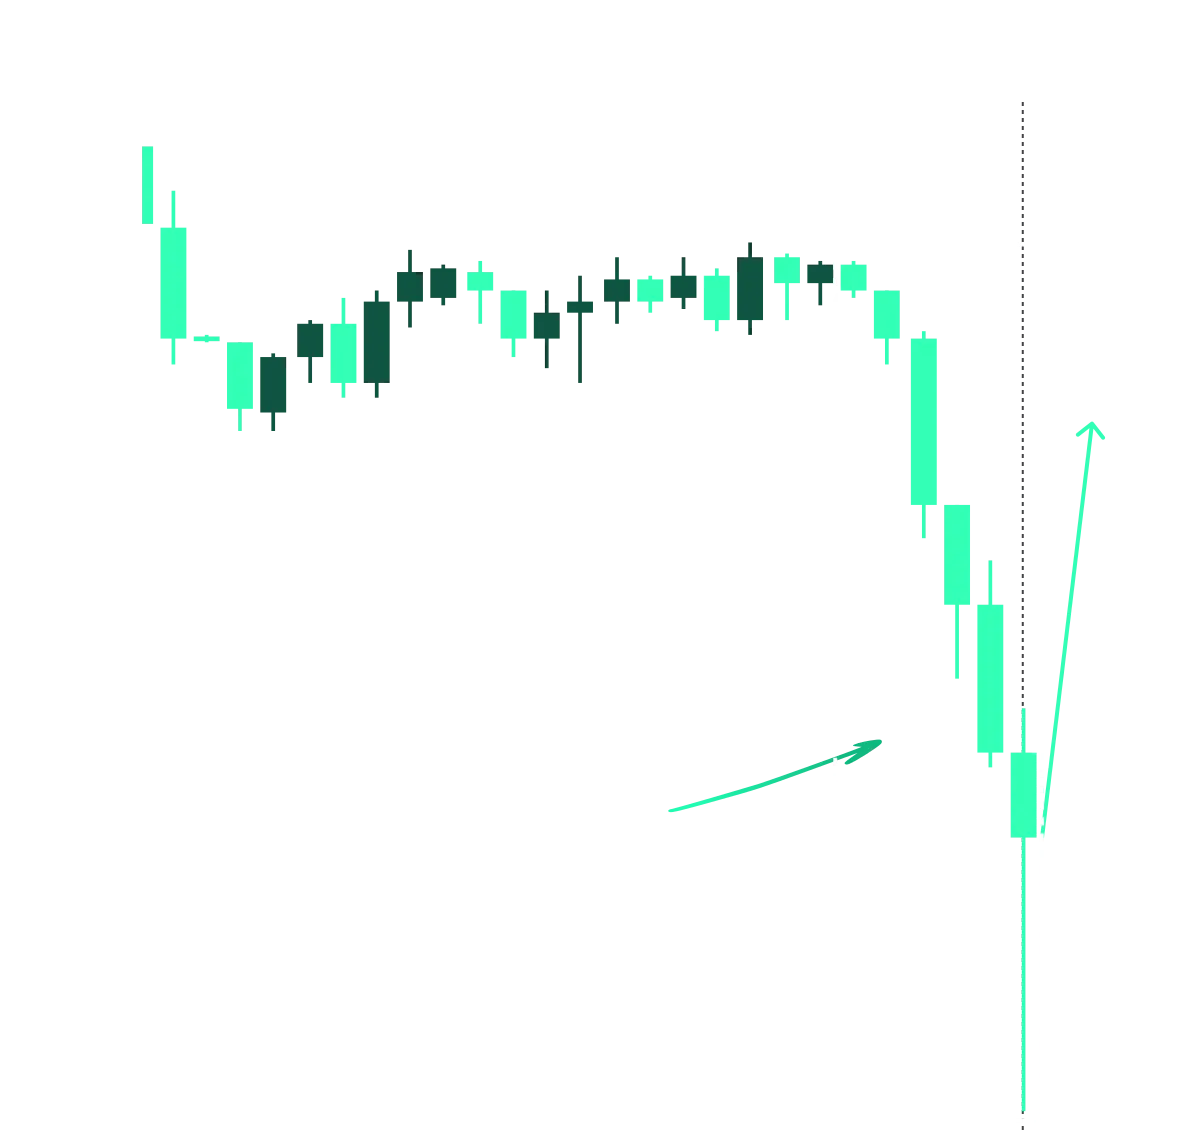
Extreme Movement
Extreme movements represent substantial price changes over short time periods. These extreme movement indicators can signal potential trading opportunities, whether through a return to an average price or the continuation of momentum, assisting traders in recognising high-impact shifts within the stock market.
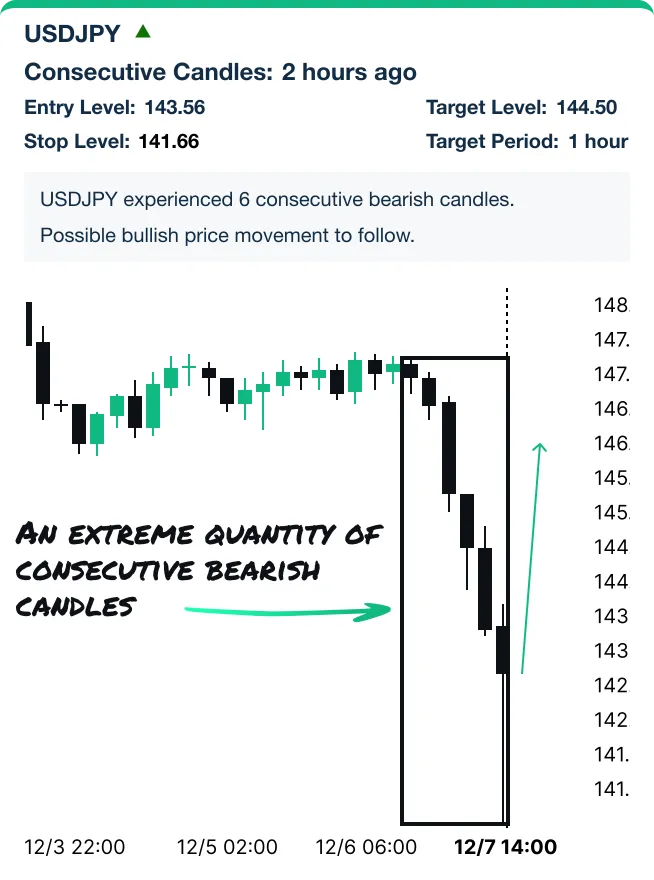
Consecutive Candles
Consecutive candles refer to a sequence of candlestick chart “candles” that consistently close higher or lower than the previous one, potentially indicating a strong trend. In a consecutive candle trading strategy, significant shifts in these sequences can help identify persistent trends in market momentum.
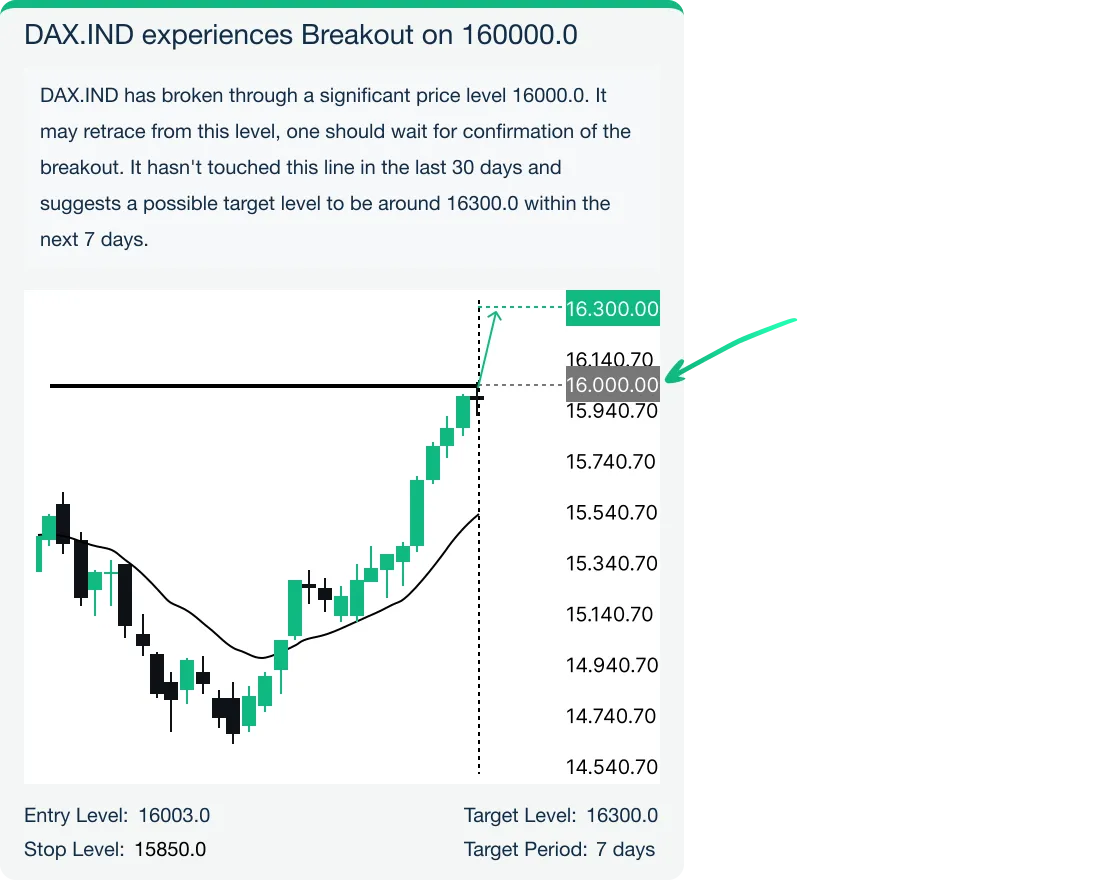
Round Numbers
Round Numbers are critical price points in the financial markets where an asset has repeatedly demonstrated support or resistance. These are levels where the price has historically reacted multiple times, showing either a reluctance to move beyond (resistance) or a tendency to bounce back (support). Support and resistance mapping of these significant levels offers insights into areas where the price frequently reacts.