Technical Analysis
Technical Analysis involves analysing historical data to present likely price behaviour in financial markets. Autochartist technical analysis uncovers patterns in market data to identify trends and market movements based on historical price action and volume.
Technical Chart Patterns – Emerging & Breakout
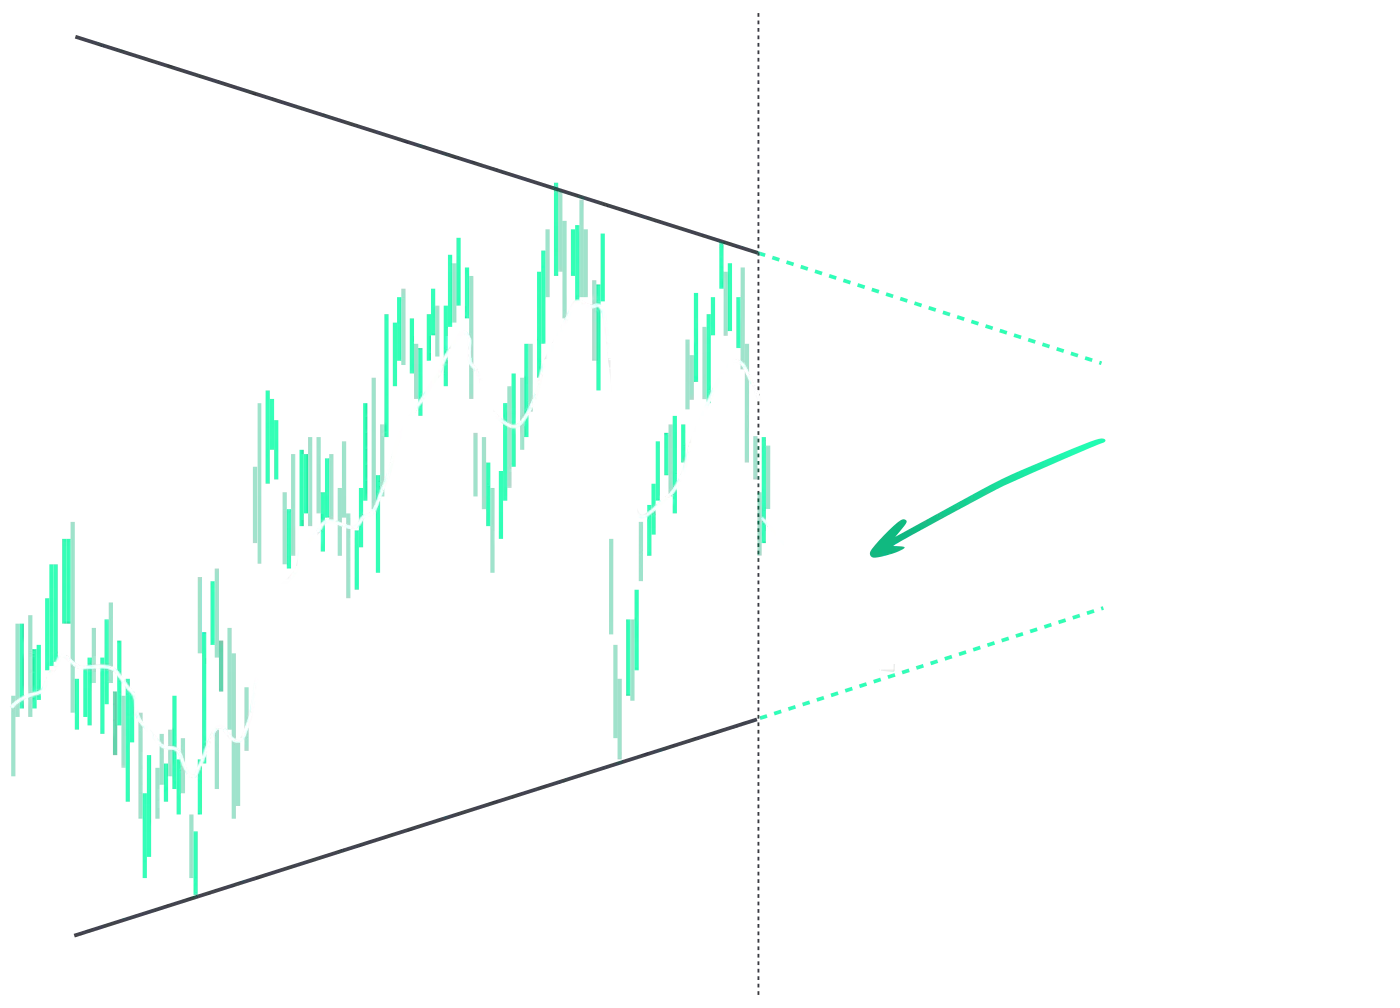
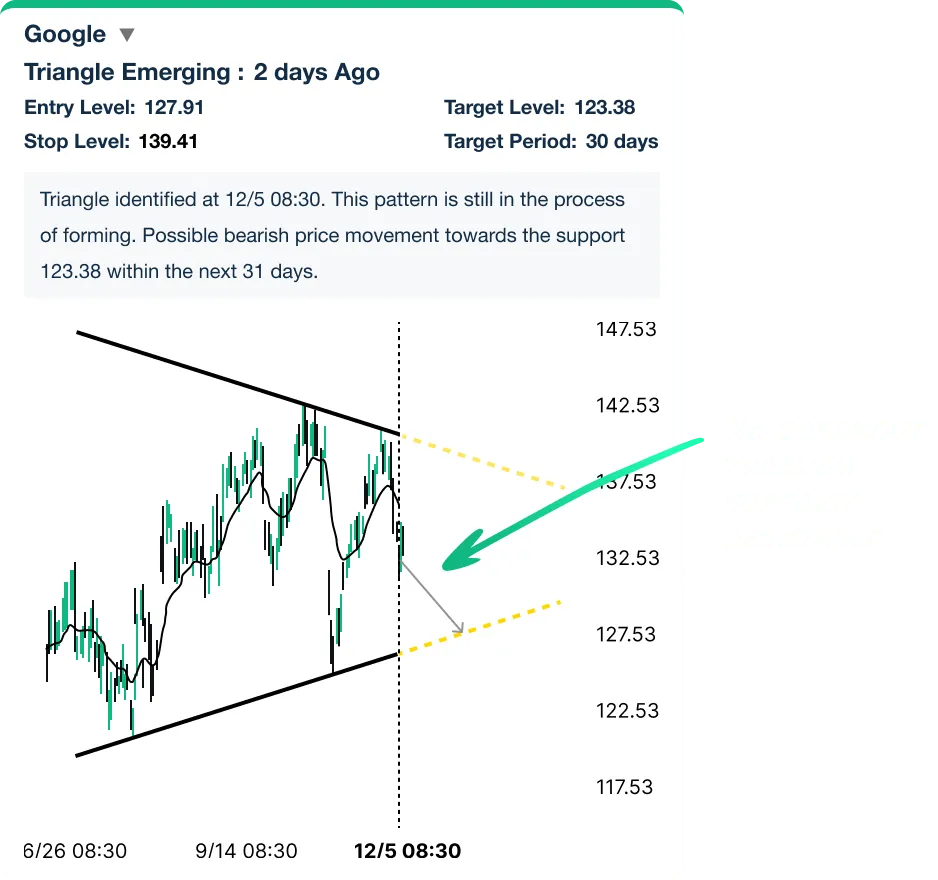
These technical chart patterns visually represent potential price movements. Some patterns signal a continuation of a current trend, while others indicate possible trend reversals. Autochartist identifies the most commonly traded technical patterns in the markets, including: Triangles (ascending and descending), Channels (up and down), Wedges (falling and rising), Rectangles, Head and Shoulders and Inverse Head and Shoulders, Flags, Pennant, and Double Top and Double Bottom.
Horizontal Support & Resistance Levels
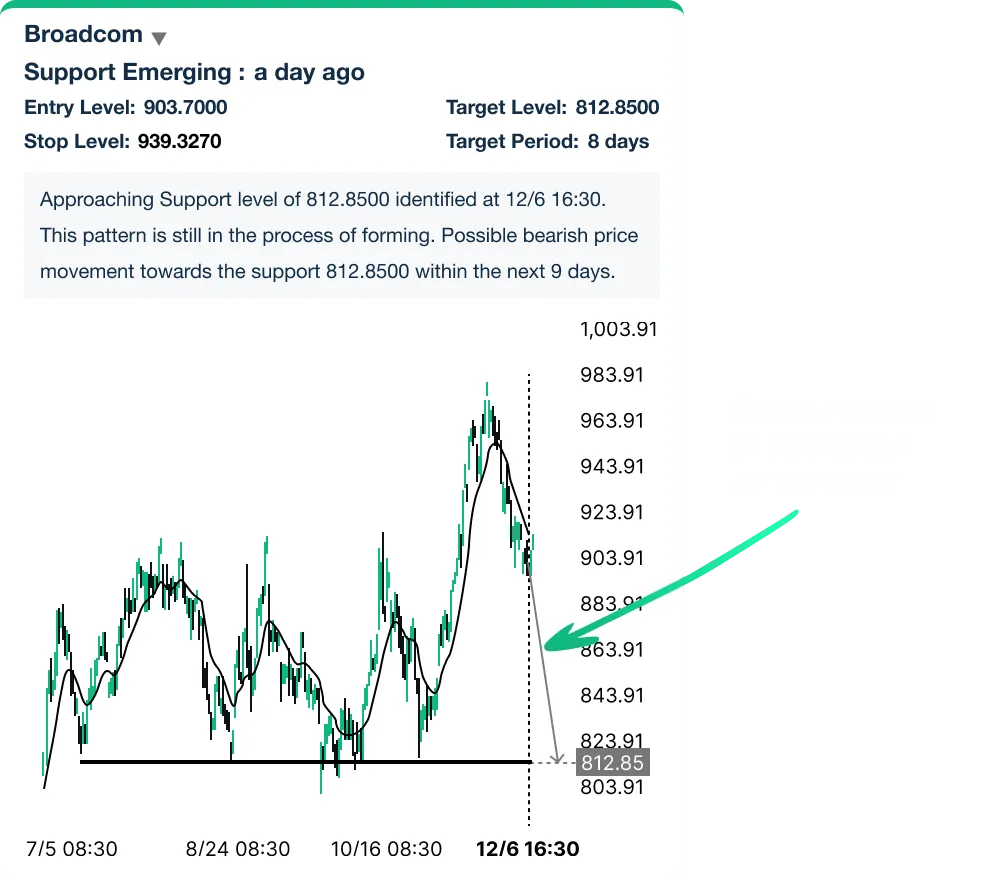
Horizontal support and resistance levels are specific price levels at which a financial instrument could encounter price support or resistance, leading to price stalling or changing direction. Autochartist identifies instances when a price moves towards these levels or breaks through support and resistance barriers, offering insights into possible market reactions.
Japanese Candlesticks
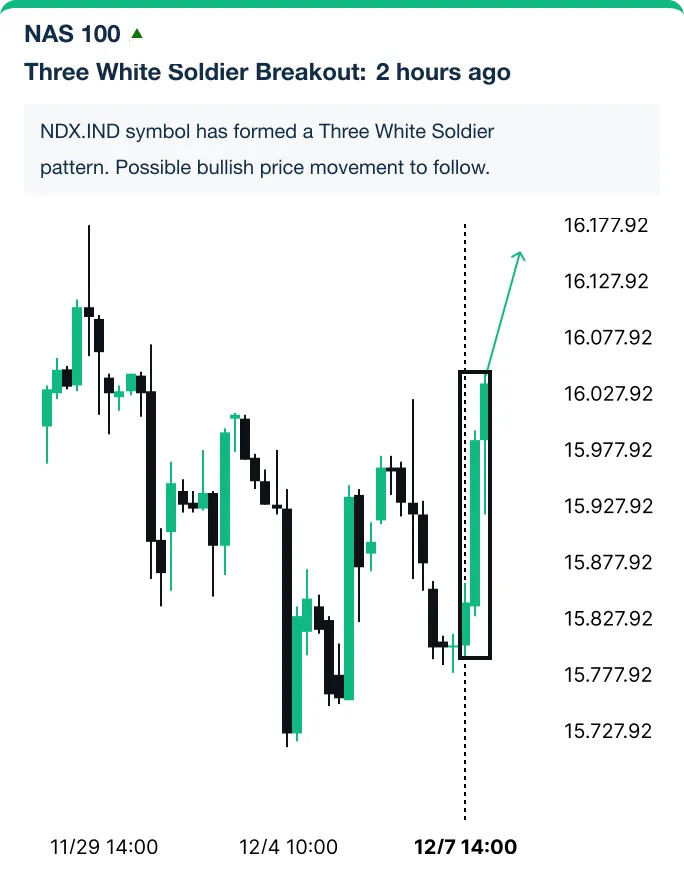
Japanese Candlestick patterns are a popular method within technical analysis used to interpret price movements in the financial markets. These patterns consist of individual “candles” representing specific periods, showing the open, close, high, and low prices during that time. Autochartist recognises and analyses various Japanese candlestick formations and identifies potential market shifts.
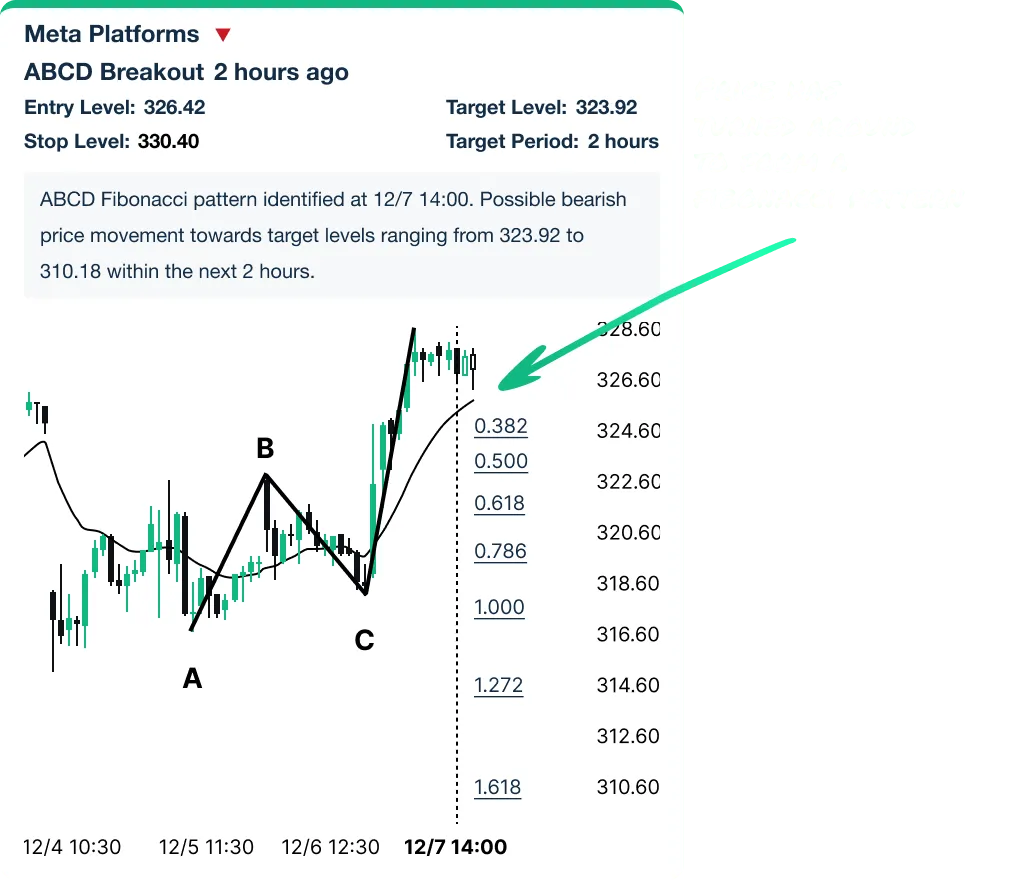
Fibonacci Patterns
Tools such as Fibonacci retracements, extensions, and levels identify potential support and resistance levels. The Fibonacci Ratio helps measure the target of a wave’s move within an Elliott Wave structure. Different waves in an Elliott Wave structure relate to one another with the Fibonacci Ratio.